Multi time frame 4D RSI
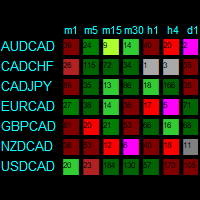
with this 4 dimensional RSI indicator you can visually get informed if there is any overbought or oversold situation in any time-frames and any currency-pairs you desire.
it has been designed based on overbought and oversold strategy. when RSI line cross down overbought level ,it might be a sell signal and the indicator will show this with a red square and when RSI line cross up the oversold level it might be a buy signal in the corresponding time frame and the indicator will show that with a green square.
numbers in the squares show the number of candles passed from cross-up or cross-down .
if RSI is absolutely in the overbought or oversold area , the corresponding square will be displayed in gray .
if buy signal is new it will be displayed in light green and if there is so many candles passed from the signal , the corresponding square will be displayed in dark green. and so for sell signal.


状态:离线 发送信件 在线交谈
姓名:顺水的鱼(先生)
职位:投机客
电话:18391752892
手机:18391752892
地区:默认地区
地址:西安市高新区软件园
邮件:3313198376@qq.com
QQ:3313198376
微信:18391752892
阿里旺旺:顺水的鱼waterfish
Skype:3313198376@qq.com