Eurusd Hidden Gap Trader
This indicator is similar to my EURUSD TAKE PROFIT indicator, except that is combatible with all brokers. As long as your broker has symbols
in the usual 'EURUSD' format, with no prefix and suffix symbols, it will work.
Basic concept:
in a nutshell...:
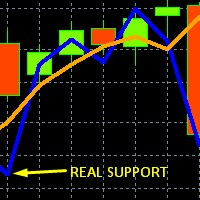
ERUUSD always moves between support and resitance levels, tests these levels, and settles before these levels prior to making a large directional move. Support and resitance is indicated here by the tips of these hidden gaps formed by the blue or orange lines.
Watch whether the market closing price settles beyond an open gap or not!
When closing price settles beyond the gap, the gap is filled, and the market trend will continue in the direction of the gap in question!
If closing market price covers half or more of the gap and settles within the gap (high low doesn't matter, only closing candle price matters) the gap is indicating unbroken support/resistance at its far end. And the trend will reverse. The market will move in the opposite direction that the gap is pointing.
This Indicator relies on intermarket analysis, using EURCHF, EURAUD, AUDUSD and the USDCHF pairs, to generate signals on EURUSD only! In order for the indicator to work, all these pairs must be available on the MT4 platform. The fundamental idea relies on EURCHF and how money flows in and out of safe haven markets and in and out of risk markets. EURO being a risk market and Swiss Franc being a safe haven market... As the idea evolved, the indicator improved by adding the other pairs.
This indicator takes some time to learn, but it does work well in
providing exit signals and warnings. It is hard to use because markets
are hard to trade, it couldn't be otherwise. And it is a specialized
indicator, specifically developed for EURUSD, as I only develop and test
specialized algorithms. I have been studying the markets for 18 years,
and have found that generic strategies don't work!
This indicator is currently being used in an experimetal highly
complicated EA that I am developing, where the objective was for this
indicator to cut through the volatility of EURUSD. So that the trade in
question is exited at better profit, before price reverses off the
high/low, and to also avoid entering trades when the indicator warns so.
Eventually after about one year of trial and error, a proper exit
indicator was made.
1)The indicator consists of a blue and orange line, these lines
express intermarket supply/demand forces of the other pairs relative to
EURUSD. Generally, when the blue line is above the orange line EURUSD
goes up, and when the blue line is below the orange line EURUSD goes
down. But this is not very useful since the blue-orange lines can
overshoot each other.
2)The original task of the indicator (before discovering the gaps) was to tell us when to get out of the trade, or whether not to trade at all. So this is indicated by the orange line! If the market has been going up and the orange line drops below the open, it's time to get out of long trades. If the market has been going down and the orange line rises above the open it's time to get out of short trades!
3)When the blue and orange lines seem to momentarily exactly match
the high/low (or low/high) of the latest candle, this is a sign that
the high/low has been made!
4)If a new candle begins, and the orange line is way above the open, all short trades should be avoided! Likewise, if the orange line is way below the open, all long trades should be avoided!
5)It was found that the indicator also reveals hidden gaps between EURUSD and the related pairs. These gaps are formed by either or both lines, and indicate levels of supply/demand, that EURUSD will likely fill these gaps and stall at those levels. It's not a directional indicator, but it works just like gaps in classic charting theory.


 nload="if(window.viewGallery_GalleryManager) viewGallery_GalleryManager.ImageonLoad(this,7);" />
 nload="if(window.viewGallery_GalleryManager) viewGallery_GalleryManager.ImageonLoad(this,8);" />
 nload="if(window.viewGallery_GalleryManager) viewGallery_GalleryManager.ImageonLoad(this,9);" />
 nload="if(window.viewGallery_GalleryManager) viewGallery_GalleryManager.ImageonLoad(this,10);" />
状态:离线 发送信件 在线交谈
姓名:顺水的鱼(先生)
职位:投机客
电话:18391752892
手机:18391752892
地区:默认地区
地址:西安市高新区软件园
邮件:3313198376@qq.com
QQ:3313198376
微信:18391752892
阿里旺旺:顺水的鱼waterfish
Skype:3313198376@qq.com