Eurusd Intermarket Matrix Indicator
This indicator is the solution to much of the EURUSD's trading patterns. It's an improvement of the original set of data, but with an entirely new algorithm based on the Blueline. Total development and research time was more than 2 years!!
It analyzes EURUSD's movement into real or false movement, if the move is false the indicator will give an alert for the real underlying trend. By knowing false moves we can buy dips as the market falls, or sell rallies as the market rallies, the market will trade back through the level at which the alert was given.
Further features will be added, in later versions, according to clients' demands. An EA based on this algorithm is also in the making, it has
passed the tough EA tests of being profitable over any 3 hours. The EA however is very selective, manual trading with the indicator takes
time, but is 3-4 times more profitable, plus it reveals the longer, day to day trend. The EA is almost ready, but requires few more functions
for ECN brokers, and acc balance checks. Please ask me for guidance on specific strategies.
This algorithm needs data from all these 8 forex pairs to work, so please make sure they are available at your MT4 terminal!
1)EURCHF
5)EURCAD
2)EURAUD
6)EURGBP
3)AUDUSD
7)GBPUSD
4) USDCHF
8)USDCAD
All these pairs are needed in the algorithm, and it only predicts EURUSD. Where EURUSD stands relative to all these 8 pairs, and it can reveal
turning points as well as the real major trend for the day, next day, or even next few weeks.
It is specifically setup to give alerts on the 30min chart, from about 20 seconds after the 30min bar starts, to 10 seconds before it ends, this way the opening time volatility is ignored. It works great on this chart, but sometimes signals may show up even on daily or weekly charts.
It can take up to 1 hour or more just to get an alert of the type ''Underlying direction is up (or down) for the next few hours!'' in this case, the blueline has diverged so much out of range, that it exceeds the other two lines, and it is bound to reverse in the coming hours, anything from few hours to 24 hours. This is the underlying trend of EURUSD, so you can evaluate open trades, which ones to keep, and which ones to close.
alerts of the type "Latest price bar is finding resitance (or support)" relate only to the latest price bar, and not to the
underlying trend!
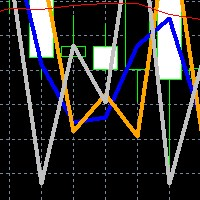
Powerful Blueline signals (underlying trend):
BUY signal - the greyline is below the orange line, while the blueline is even lower, lower than the grey line!
SELl signal - the greyline is higher than the orange line, while the blueline is higher still, higher than the grey line!
On the 30min chart, you will see these signals as they happen in real time, but on the daily or weekly they may happen once in a while, they
may happen very briefly and you will not see them, except some cases where the Day/Week closes such that the blueline ends at an extreme level.
(This is subject to further research for improving this indicator and for using the algorithm in Expert Advisors), but for now this is all I have to offer, the best strategy is this one, based on these specific setups.
Last bar Support/Resistance signals, these alerts are optional, they relate to the latest price bar only, not to the underlying trend, they occur when the blueline stands exactly in between the other 2 lines. Sometimes I find this alert useful, but it can also be anooying, so there's a disable option.
The real power of this indicator is with blueline extremes, these are the indications about the prevailing expected trend in EURUSD, after correcting some coding mistakes from the early versions of this indicator, we can now use it for real.
I can actually trade EURUSD using this indicator, and never lose. There's drawdown, not all trades become profitable right
away, but I can avoid all major traps that would have been losing trades.
How to test and evaluate this indicator:
1) First check on the Daily and weekly charts, to see if there are any major, visible buy/sell signals according to the patterns described above.
2)Go to the 30min chart, and wait for the first alert on the underlying trend, it can take 1 hour for that to happen, since elapsed signals are not
possible to scan. Wait, and as soon as the first alert comes, notice how the market will end up going in the coming hours, not
necessarily from that bar.


 nload="if(window.viewGallery_GalleryManager) viewGallery_GalleryManager.ImageonLoad(this,7);" />
 nload="if(window.viewGallery_GalleryManager) viewGallery_GalleryManager.ImageonLoad(this,8);" />
状态:离线 发送信件 在线交谈
姓名:顺水的鱼(先生)
职位:投机客
电话:18391752892
手机:18391752892
地区:默认地区
地址:西安市高新区软件园
邮件:3313198376@qq.com
QQ:3313198376
微信:18391752892
阿里旺旺:顺水的鱼waterfish
Skype:3313198376@qq.com