Monthly Pivot
What is Pivot?
"In financial markets, a pivot point is a price level that is used by traders as a possible indicator of market movement. A pivot point is calculated as an average of significant prices (high, low, close) from the performance of a market in the prior trading period." - wikipedia
What is Monthly Pivot?
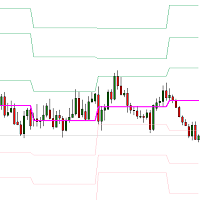
This MT4 indicator plots monthly pivot points. Price tends to return to this monthly pivot line over a period of time.
- The Magenta line in the chart is the monthly pivot line.
- The green lines are the R1, R2, R3 of the monthly pivot.
- The red lines are the S1, S2, S3 of the monthly pivot.
Congratulations, you've found an Easter egg. So, here's a secret: If you look at the charts below, you will see that price tend to return to the magenta pivot line over a period of time :)


ta itemprop="image" content="https://c.mql5.com/31/308/monthly-pivot-screen-8940.png" />

联系方式
公司:顺水的鱼外汇EA
状态:离线 发送信件 在线交谈
姓名:顺水的鱼(先生)
职位:投机客
电话:18391752892
手机:18391752892
地区:默认地区
地址:西安市高新区软件园
邮件:3313198376@qq.com
QQ:3313198376
微信:18391752892
阿里旺旺:顺水的鱼waterfish
Skype:3313198376@qq.com
状态:离线 发送信件 在线交谈
姓名:顺水的鱼(先生)
职位:投机客
电话:18391752892
手机:18391752892
地区:默认地区
地址:西安市高新区软件园
邮件:3313198376@qq.com
QQ:3313198376
微信:18391752892
阿里旺旺:顺水的鱼waterfish
Skype:3313198376@qq.com