RSI Dashboard MTF
RSI Dashboard MTF is a multi-timeframe and multi-currency indicator that uses RSI indicator to detect trend.
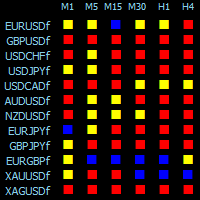
It can show up to 12 currency pair with all time-frames included from M1 up to MN1.
RSI Dashboard MTF help you detect trend on different currency pairs and you can switch to that currency in order to take a trade in direction of the trend.
Indicator Parameters
RSI Settings
Period - This is the RSI period used in calculations.
Buy Higher Than This Level - If RSI in a timeframe of a currency pair is above this level, that timeframe of the currency pair is considered an uptrend.
Sell Lower Than This Level - If RSI in a timeframe of a currency pair is below this level, that timeframe of the currency pair is considered a downtrend.
Currency Pair Suffix - You must add the suffix for your pairs if any. For example your EURUSD chart might be like EURUSDf. In this case you enter f in this field.
You can add up to 12 currency pairs in the next fields.
You can choose on which corner of the chart the indicator is shown.
Also you can change the color for uptrend and downtrend.


状态:离线 发送信件 在线交谈
姓名:顺水的鱼(先生)
职位:投机客
电话:18391752892
手机:18391752892
地区:默认地区
地址:西安市高新区软件园
邮件:3313198376@qq.com
QQ:3313198376
微信:18391752892
阿里旺旺:顺水的鱼waterfish
Skype:3313198376@qq.com