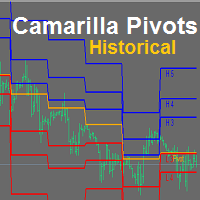
Camarilla Pivots Historical
Camarilla Pivots Historical plots the historical data of the camarilla pivot point levels on the chart. The Camarilla Pivot levels was originated in 1989 by Nick Scott. The levels are used as primary support and resistance levels by Intraday traders. The levels are calculated with the following formula:
- R4 = C + RANGE * 1.1/2
- R3 = C + RANGE * 1.1/4
- R2 = C + RANGE * 1.1/6
- R1 = C + RANGE * 1.1/12
- PP = (HIGH + LOW + CLOSE) / 3
- S1 = C - RANGE * 1.1/12
- S2 = C - RANGE * 1.1/6
- S3 = C - RANGE * 1.1/4
- S4 = C - RANGE * 1.1/2
Other than for primary support and resistance, popular usage of the levels include risk management and Intraday trading.
Introducing : Pivots Dashboard . Its an fx tool that displays all pivot point levels/methods ( Cammarilla Pivots,Woody Pivots,Standard Pivots,Fibonacci Pivots,DeMark Pivots) for all currency pairs in one dashboard. Also has Pivot Breakout notification for (PopUp alert,Email , Phone) . Available @ https://www.mql5.com/en/market/product/24341


状态:离线 发送信件 在线交谈
姓名:顺水的鱼(先生)
职位:投机客
电话:18391752892
手机:18391752892
地区:默认地区
地址:西安市高新区软件园
邮件:3313198376@qq.com
QQ:3313198376
微信:18391752892
阿里旺旺:顺水的鱼waterfish
Skype:3313198376@qq.com