Supply and Demand Dashboard PRO
This DASHBOARD is a very powerful piece of software working on multiple symbols and up to 9 timeframes.
It is based on our main indicator (Best reviews: Advanced Supply Demand).
The new DASHBOARD gives a great overview. It shows:
- filtered Supply and Demand values including zone strength rating,
- pips distances to/and within zones,
- it highlights nested zones,
- it gives 4 kind of alerts for the chosen symbols in all (9) time-frames.
- It is highly configurable for your personal needs!
important Information Revealed
Maximize the potential of Supply and Demand, please visit https://www.mql5.com/en/blogs/post/725584 (User manual)
If you are new to supply demand trading read also https://www.mql5.com/en/blogs/post/720245
ADVANCED FEATURES:
4 KIND OF alertS:
- A new zone appeared.
- Price entered a zone.
- Price left the zone.
- The zone is broken.
- If you wish, you can filter all alerts for only nested zones.
- You can choose the timeframes which should be alerted.
- You can exclude symbols from the alert.
VISUAL FEATURES ON DASHBOARD
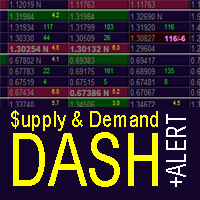
- Prices for supply and demand. (From up to down: supply upper price / supply lower price / demand upper price / demand lower price)
- Pips distances until supply and demand. Green, if price is far from zone.
- Pips distances within supply and demand. Pink and bold, if price has entered the zone. (pips to outer price / pips to inner price)
- A special zone strength rating. Yellow number, if a minimum strength is reached.
- New or tested: "N" is added to price if the zone is still untested or new.
- Nested: the background is highlighted if the zone is nested within the higher timeframe zone.
- Nested AND new: Prices for supply and demand showing in bold.
VISUAL FEATURES ON CHART
Simply drag the sub-window of the dashboard down with the mouse to see the actual chart. Click on the symbol names to change the symbol.
- All timeframes showing in the dashboard will be drawing on the chart.
- Lower timeframes than the chart showing as dashed squares.
- Actual timeframe of chart showing as full squares.
- Higher timeframes than chart showing as empty squares.
- The higher the timeframe is the more to the right the squares end.
- Color code will show if the zone is new or tested.
- Prices can be shown on chart or not.


 nload="if(window.viewGallery_GalleryManager) viewGallery_GalleryManager.ImageonLoad(this,7);" />
联系方式
公司:顺水的鱼外汇EA
状态:离线 发送信件 在线交谈
姓名:顺水的鱼(先生)
职位:投机客
电话:18391752892
手机:18391752892
地区:默认地区
地址:西安市高新区软件园
邮件:3313198376@qq.com
QQ:3313198376
微信:18391752892
阿里旺旺:顺水的鱼waterfish
Skype:3313198376@qq.com
状态:离线 发送信件 在线交谈
姓名:顺水的鱼(先生)
职位:投机客
电话:18391752892
手机:18391752892
地区:默认地区
地址:西安市高新区软件园
邮件:3313198376@qq.com
QQ:3313198376
微信:18391752892
阿里旺旺:顺水的鱼waterfish
Skype:3313198376@qq.com