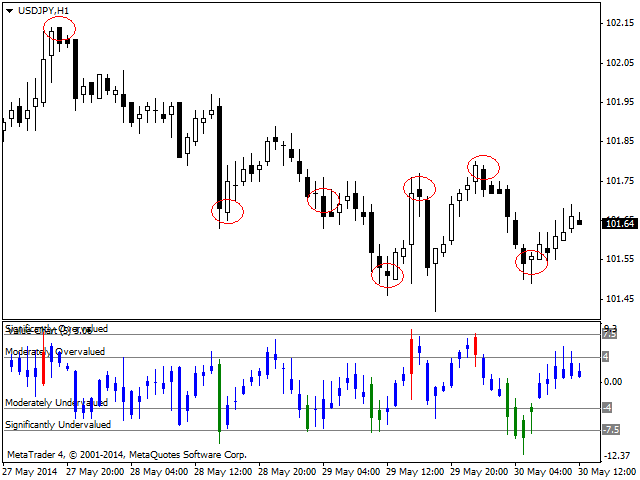
Value Chart for MT4
Value Charts (Helweg and Stendahl, 2002) is an innovative charting technique that displays price in terms of value instead of cost even when price volatility changes over time. It shows you when a particular market is at an extreme level and is likely to reverse.
How to interpret
The Value Chart indicator defines market valuation by plotting price in one of five primary valuation zones, which include:
- Significantly Overvalued
- Moderately Overvalued
- Fair Value
- Moderately Undervalued
- Significantly Undervalued
When the Value Chart indicator reaches a significant level, the bar is coloured appropriately to indicate a long or a short opportunity. It turns red when an instrument is significantly overvalued (short opportunity) and green when significantly undervalued (long opportunity).
Trading strategy example
Bull markets tend to have quick, sharp pullbacks and then slow grinding moves higher. In this strategy we use the Value Chart to identify temporary pullbacks to join the trend.
- Use a moving average or the Hysteresis indicator to determine the overall trend.
- once an uptrend is indicated by the moving average, look to buy when the market trades below the -8 Value Chart price level.
状态:离线 发送信件 在线交谈
姓名:顺水的鱼(先生)
职位:投机客
电话:18391752892
手机:18391752892
地区:默认地区
地址:西安市高新区软件园
邮件:3313198376@qq.com
QQ:3313198376
微信:18391752892
阿里旺旺:顺水的鱼waterfish
Skype:3313198376@qq.com

