MWC Visualizer
Unfortunately, if somebody liked to develop a strategy for smaller time levels than W1 based on the CoT data, this is not so simple, since there are no tools showing CoT data for a smaller level. With the MWC Visualizer, you have the possibility now of looking and analyzing the changes in the CoT at all time levels smaller than W1! In the demo version, you can watch the price developments in details after an event of the MWC Ratio indicator happened.
How to Use MWC Visualizer
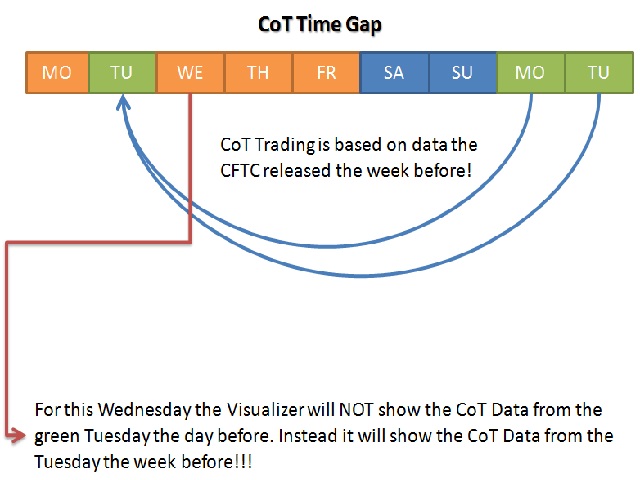
The demo version 1.0 is similar like the MWC Ratio Indicator with the great difference that one can look on the time levels down to M1. Additionally, the user can see the CoT released timestamps. Please check the screenshots to attain a better understanding of this feature.
The settings for the CoT timestamps (VLines) are:
- VLineShow = true/false - switches CoT timestamps on/off.
- VLineMonday = true/false - switches between normal view (timestamp on release day of CoT) or Monday view (the day normally your CoT strategy is starting).
- VLineWIDTH - line width.
- VLineCLR - line color.
Please make sure that you downloaded the latest data set from MyWeeklyCoT http://www.myweeklycot.com/cot/demo/[Year]/MWC_RAT.dat (only EURUSD is free of charge) and copied it into [...]/MQL4/Files folder.
状态:离线 发送信件 在线交谈
姓名:顺水的鱼(先生)
职位:投机客
电话:18391752892
手机:18391752892
地区:默认地区
地址:西安市高新区软件园
邮件:3313198376@qq.com
QQ:3313198376
微信:18391752892
阿里旺旺:顺水的鱼waterfish
Skype:3313198376@qq.com

