Rsi Channel
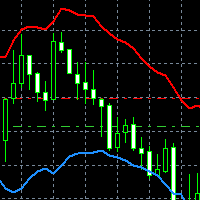
This indicator displays the channel of Relative Strength Index.
When you see that the price touches the red line and retreats from it many times, then you will know that the general trend is down.
When it retreats from the blue line many times, that means that the general trend is up.
This lines express the RSI values attributed to the price values on the main chart.
You can add this indicator to your strategy, it will help you.
You will have a chance to enter the market when the price touches the lines but it isn't a strong signal.
This indicator will work best on 5 minutes and higher time frames.
Indicator properties:
- RSI_PERIOD: is the period, on which you want to display the indicator


联系方式
公司:顺水的鱼外汇EA
状态:离线 发送信件 在线交谈
姓名:顺水的鱼(先生)
职位:投机客
电话:18391752892
手机:18391752892
地区:默认地区
地址:西安市高新区软件园
邮件:3313198376@qq.com
QQ:3313198376
微信:18391752892
阿里旺旺:顺水的鱼waterfish
Skype:3313198376@qq.com
状态:离线 发送信件 在线交谈
姓名:顺水的鱼(先生)
职位:投机客
电话:18391752892
手机:18391752892
地区:默认地区
地址:西安市高新区软件园
邮件:3313198376@qq.com
QQ:3313198376
微信:18391752892
阿里旺旺:顺水的鱼waterfish
Skype:3313198376@qq.com