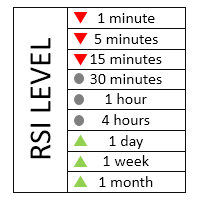
Multitimeframe RSI Monitor
The indicator Multitimeframe RSI Monitor shows the Relative Strenght index(RSI) status in every timeframe of metatrader 4, according to your selected Overbought and Oversold levels. The triangle pointing up indicates an oversold level, the triangle pointing down indicates an overbought level and the circle indicates a neutral level.
Input parameters
- RSI period: Period for RSI calculation.
- RSI Applied Price: Price for the RSI calculation.
- Overbought Level: You customize you own Overbought Level
- Oversold Level: You customize you own Oversold Level
- Title Color: Title color
- Text Color: Text color (Timeframe labels)
- Overbought triangle color: Overbought triangle color
- Oversold triangle color: Oversold triangle color
- Neutral color: Circle color for neutral levels
- Background color: Backgroung color
- Show in this corner: Select the place to show the information


联系方式
公司:顺水的鱼外汇EA
状态:离线 发送信件 在线交谈
姓名:顺水的鱼(先生)
职位:投机客
电话:18391752892
手机:18391752892
地区:默认地区
地址:西安市高新区软件园
邮件:3313198376@qq.com
QQ:3313198376
微信:18391752892
阿里旺旺:顺水的鱼waterfish
Skype:3313198376@qq.com
状态:离线 发送信件 在线交谈
姓名:顺水的鱼(先生)
职位:投机客
电话:18391752892
手机:18391752892
地区:默认地区
地址:西安市高新区软件园
邮件:3313198376@qq.com
QQ:3313198376
微信:18391752892
阿里旺旺:顺水的鱼waterfish
Skype:3313198376@qq.com