KFX Support and Resistance
The indicator shows the support and resistance levels as lines of the higher timeframes. You can do the indicator in any time window. only the data of the timeframes from H1 to W1 will be displayed. Thus it is perfect for small timeframes, where you are looking for the entries after the course has respected a line.
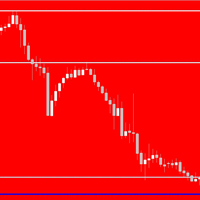
In the Screenshots are pictures in which I show live trades. These are displayed with the KFX Trade Plotter.
How to use the indicator to analyse the chart
With the indicator, you can choose which timeframes should be displayed (H1, H4, D1 or W1). In addition, the indicator has a candletime display. I use the indicator in the M15 timeframe. In addition, I have in the last screenshot briefly listed how to analyze a currency pair and with the KFX support and restistance indicator is best to start an entrance, where one has several conformations. I am always looking for at least 3 conformations.
I would like to list them briefly:
- Price respects a support or restistance line
- RSI shows a divergence
- Candle formation is W or M, support or resistance line is touched 2 times
Parameters
- Candle_Closing_Time
- location - select between 1-4 where the time display should be displayed (chart corner)
- displayservertime - select 1 if you want next to the candle closing time the server time
- fontSize - size of the displayed ad
- SHOW_H1 - turn on, if you want this line in the chart
- SHOW_H4 - turn on, if you want this line in the chart
- SHOW_D1 - turn on, if you want this line in the chart
- SHOW_W1- turn on, if you want this line in the chart
- Supply_Demand_Area - size of the indicated support and resistance line
- All colors are adjustable for the user


 nload="if(window.viewGallery_GalleryManager) viewGallery_GalleryManager.ImageonLoad(this,7);" />
状态:离线 发送信件 在线交谈
姓名:顺水的鱼(先生)
职位:投机客
电话:18391752892
手机:18391752892
地区:默认地区
地址:西安市高新区软件园
邮件:3313198376@qq.com
QQ:3313198376
微信:18391752892
阿里旺旺:顺水的鱼waterfish
Skype:3313198376@qq.com